04 / Research8 steps · Voice + captions
Search a market and use chart tools
Follow each click: symbol, market, timeframe, indicator and live feeds.
Market data · paper trading
Read the 8 steps
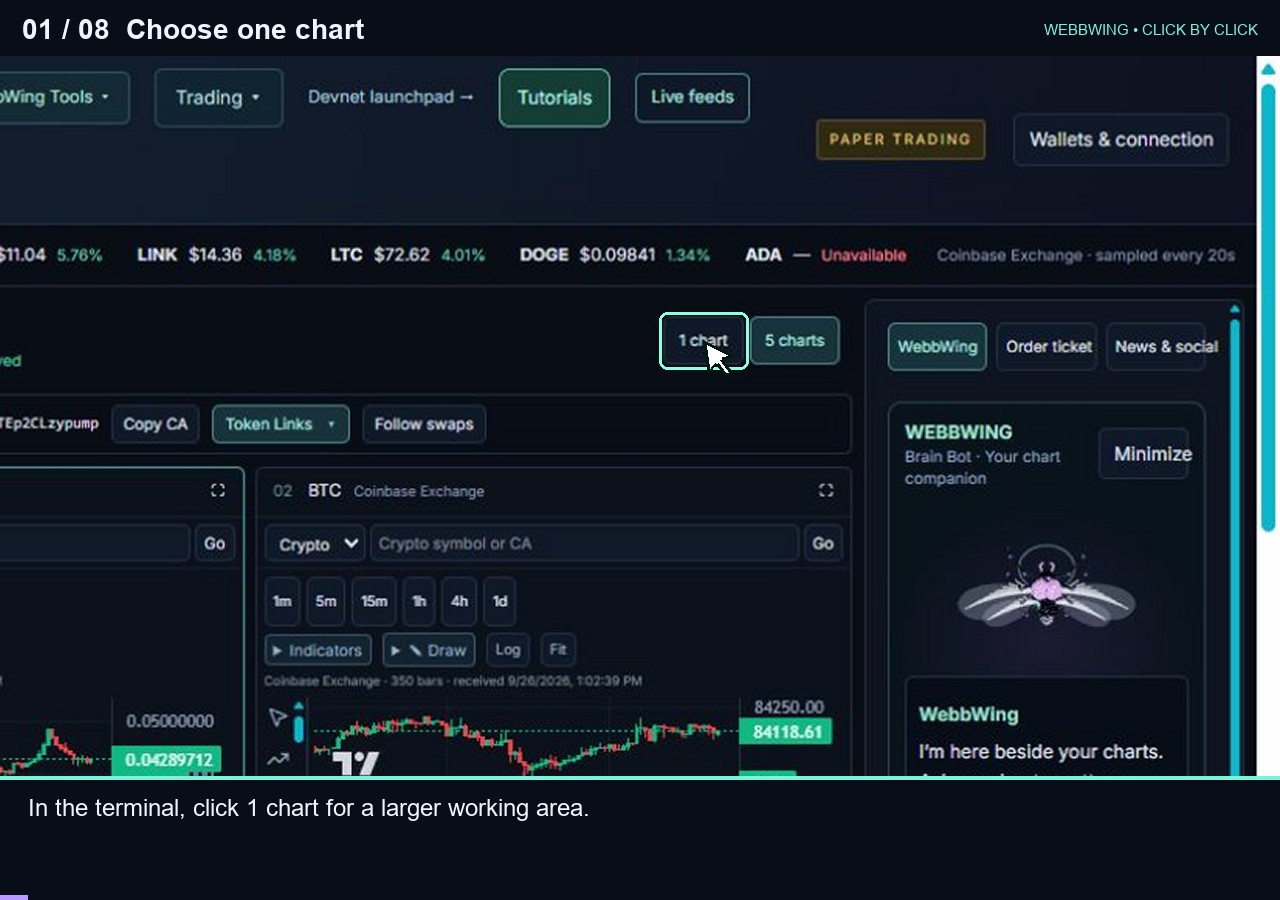
- Choose one chart
In the terminal, click 1 chart for a larger working area. The first chart expands. You can return to five charts using the adjacent button.
- Enter a symbol or contract
Click the chart search field and type BTC for this example. You can also paste a token contract address. Confirm the network and full address.
- Run the search
Click the small search button beside the field. Matching markets appear below. Similar symbols can refer to different tokens.
- Choose the correct market
Select BTC slash USD from Coinbase Exchange in the results. The chart loads that market. Check its name and data source above the candles.
- Change the timeframe
Click 15m to select fifteen minute candles. The chart redraws at the new interval. The highlighted timeframe shows your selection.
- Open Indicators
Click Indicators above the chart. The indicator menu opens with the available overlays.
- Add SMA 20
Click SMA 20 in the indicator menu. A moving average is added to the chart. Click Indicators again to close the menu.
- Open Live feeds
Scroll back to the top, then click Live feeds in the header. The activity table shows connected sources. Check timestamps and coverage; it does not include every trade on every market.
Recorded market values are examples from September 26. The terminal’s order workflow uses paper funds.
 0:32